Gold Is at A Crossroads: What’s Next?
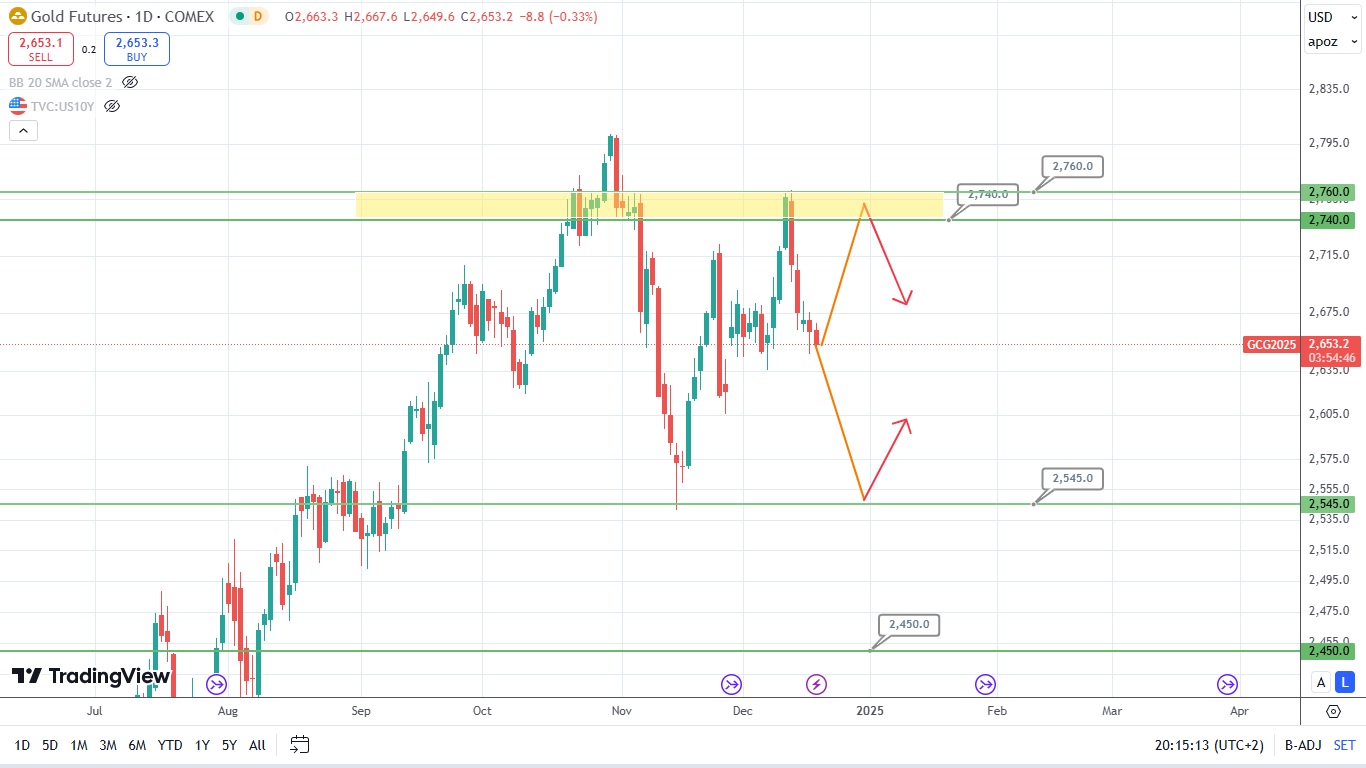
Gold is heading down, leaving the previously reached maximum price points behind. Currently, the price of gold remains in the middle point of the range located in between the resistance area formed between levels 2740 and 2760 in the above, and the supporting level of 2545 in the below. Should the asset’s price reach the lower boundary of this range, market sentiment might turn bullish. However, if the price of this asset reaches the upper boundary of this range, bears will seize the initiative. Currently, the price of gold is about to drop and head South. So, let’s wait and see what is going to be the next price movement of gold.
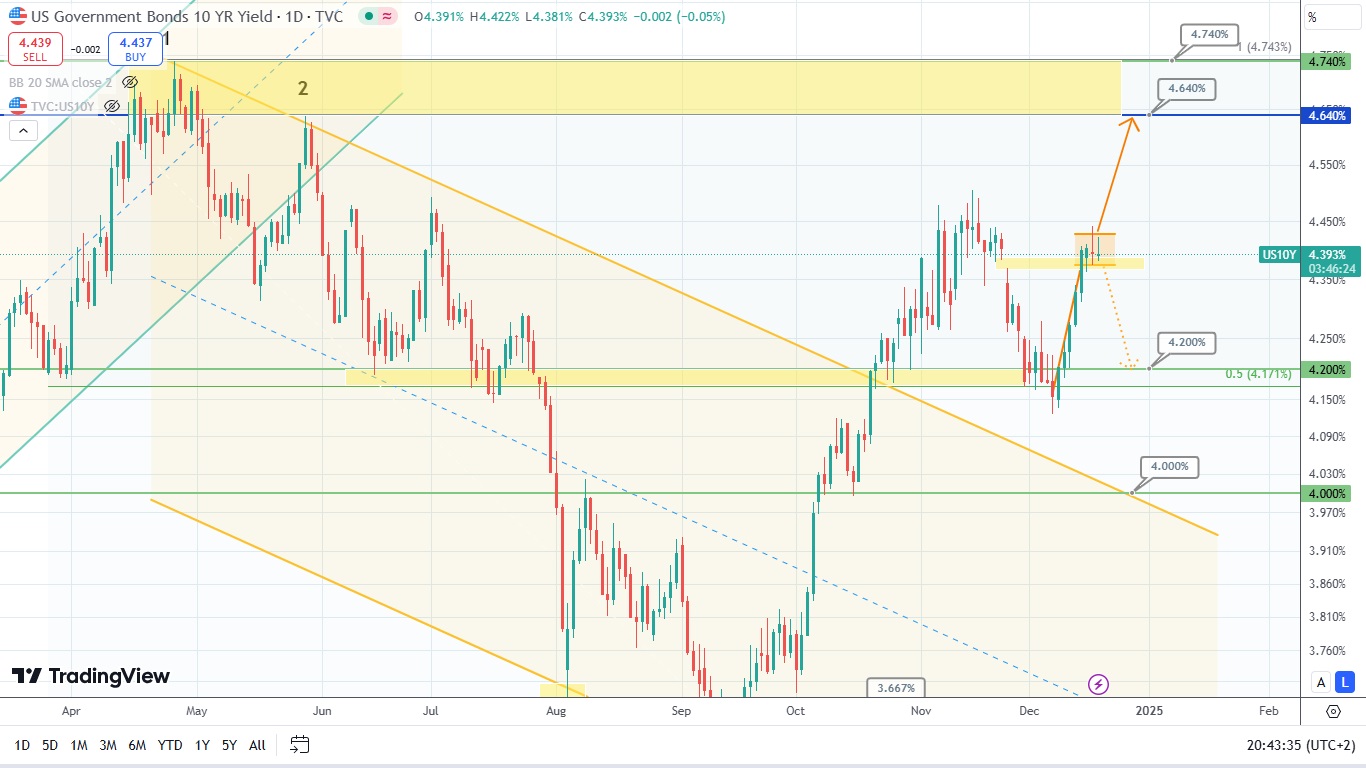
Now, the price of U.S. Government Bonds is forming small candlestick patterns. Considering the previous intensive yield increase, it looks like bulls might seize initiative and form the bullish flag. This pattern usually signifies the continuation of current trend. Although bears might bring the asset’s price down to the level of 4.2% in anticipation of the upcoming holiday season. Let’s see what is going to happen next.
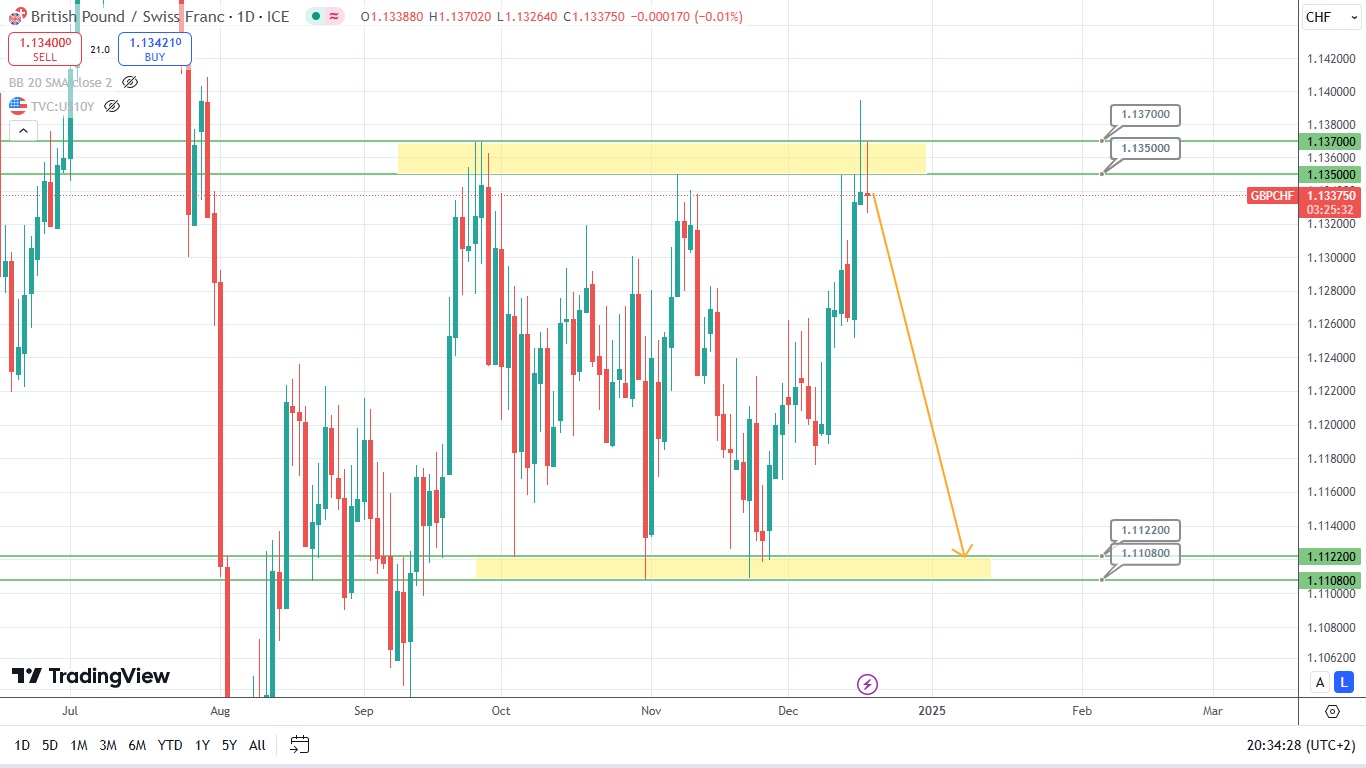
The cross rate of the currency pair GBP/CHF has tested the upper boundary of the range formed between levels 1.1370 and 1.1350 and formed the shooting start at the end of trading day. This might signify the upcoming bearish sentiment, potential price drop and market interest on the opposite side of flat, that is, the level of 1.1120. In this case, bulls might seize initiative above the level of 1.1400, ensuring the potential price rise. Time will tell whether this scenario is going to work out.
Disclaimer: The material provided is for information purposes only and should not be considered as investment advice. The views, information, or opinions expressed in the text belong solely to the author, and not to the author’s employer, organization, committee or other group or individual or company.
Past performance is not indicative of future results.
High Risk Warning: CFDs are complex instruments and come with a high risk of losing money rapidly due to leverage. 69% and 73% of retail investor accounts lose money when trading CFDs with Tickmill UK Ltd and Tickmill Europe Ltd respectively. You should consider whether you understand how CFDs work and whether you can afford to take the high risk of losing your money.
Futures and Options: Trading futures and options on margin carries a high degree of risk and may result in losses exceeding your initial investment. These products are not suitable for all investors. Ensure you fully understand the risks and take appropriate care to manage your risk.