SP500 LDN TRADING UPDATE 3/11/25
.jpg)
SP500 LDN TRADING UPDATE 3/11/25
***QUOTING ES1 CONTRACT FOR CASH US500 EQUIVALENT LEVELS SUBTRACT POINTS DIFFERENCE***
***WEEKLY ACTION AREA VIDEO TO FOLLOW AHEAD OF NY OPEN***
WEEKLY BULL BEAR ZONE 6820/10
WEEKLY RANGE RES 6981/6767
NOV EOM STRADDLE 6929/6399
NOV MOPEX STRADDLE 7054/6399
DEC QOPEX STRADDLE 6626/7025
As of Friday, the aggregate gamma flip level for the S&P 500 Index (SPX) is located around the 6800 level. This indicates a significant point where the sentiment of options traders may shift, influencing market behavior. The gamma peak, on the other hand, is identified at the 7000 mark. The gamma flip is a dynamic threshold that can change daily, reflecting the evolving positions of options traders. This level is often considered to be a key support level, suggesting that as prices approach this area, buying interest may increase, helping to stabilize prices against downward movements..
DAILY VWAP BEARISH 6873
WEEKLY VWAP BULLISH 6711
DAILY STRUCTURE – ONE TIME FRAMING LOWER - 6902
WEEKLY STRUCTURE – ONE TIME FRAMING HIGHER - 6843
MONTHLY STRUCTURE – ONE TIME FRAMING HIGHER - 6591
Balance: This refers to a market condition where prices move within a defined range, reflecting uncertainty as participants await further market-generated information. Our approach to balance includes favoring fade trades at the range extremes (highs/lows) while preparing for potential breakout scenarios if the balance shifts.
One-Time Framing Up (OTFU): This represents a market trend where each successive bar forms a higher low, signaling a strong and consistent upward movement.
One-Time Framing Down (OTFD): This describes a market trend where each successive bar forms a lower high, indicating a pronounced and steady downward movement.
GOLDMAN SACHS TRADING DESK VIEWS
What a week! Thursday brought one of the worst sessions since June, yet the SPX still managed to close just a few points away from all-time highs. For those not running the marathon and looking to use the extra daylight savings hour productively, check below for weekend prep.
What initially appeared to be the start of a cover rally last weekend was quickly met with renewed macro short selling this week. Just when you think investors can’t short more macro products, they prove otherwise. With only 10% of SPX reporting this week, we’ll need to look elsewhere for catalysts. The futures desk highlights a notable short base building in small caps—sound familiar? Interestingly, spot and call volatility are moving in the same direction (a rare occurrence), while megacap call volumes are surging, driven by earnings and massive numbers.
1. PB (Selling Macro, Buying Micro): Investors net sold U.S. equities this week, reversing the greenshoots of covering we saw last weekend. Selling was concentrated in macro products (ETFs), while single stocks were net bought. Earnings season has clearly driven an uptick in idiosyncratic trading.
2. Delta-One (Selling): Again, what looked like the start of a cover rally last weekend was met with aggressive selling from both real money (-$3.5bn) and hedge funds (-$1.6bn). The long-only community’s selling of META stands out as a key flow. This highlights how challenging the market can be—earnings beats are not being rewarded with outperformance. SPX constituents are only outperforming the index by 32bps on average, compared to the historical 100bps (see chart).
3. Futures (Rotation): The desk notes a significant increase in short positioning within small-cap futures. Jerome Powell’s comments indicating that a December rate cut is not a “done deal” could hurt longer-duration pockets of the market, with investors following suit in R2K. Anecdotally, we’ve seen this behavior before, but those aggressively shorting should be cautious of year-end performance chases. For the “seasonals” crowd, note that IWM November tends to be strong—small caps have only seen two negative Novembers in the last 15 years, with an average performance of +450bps for the month.
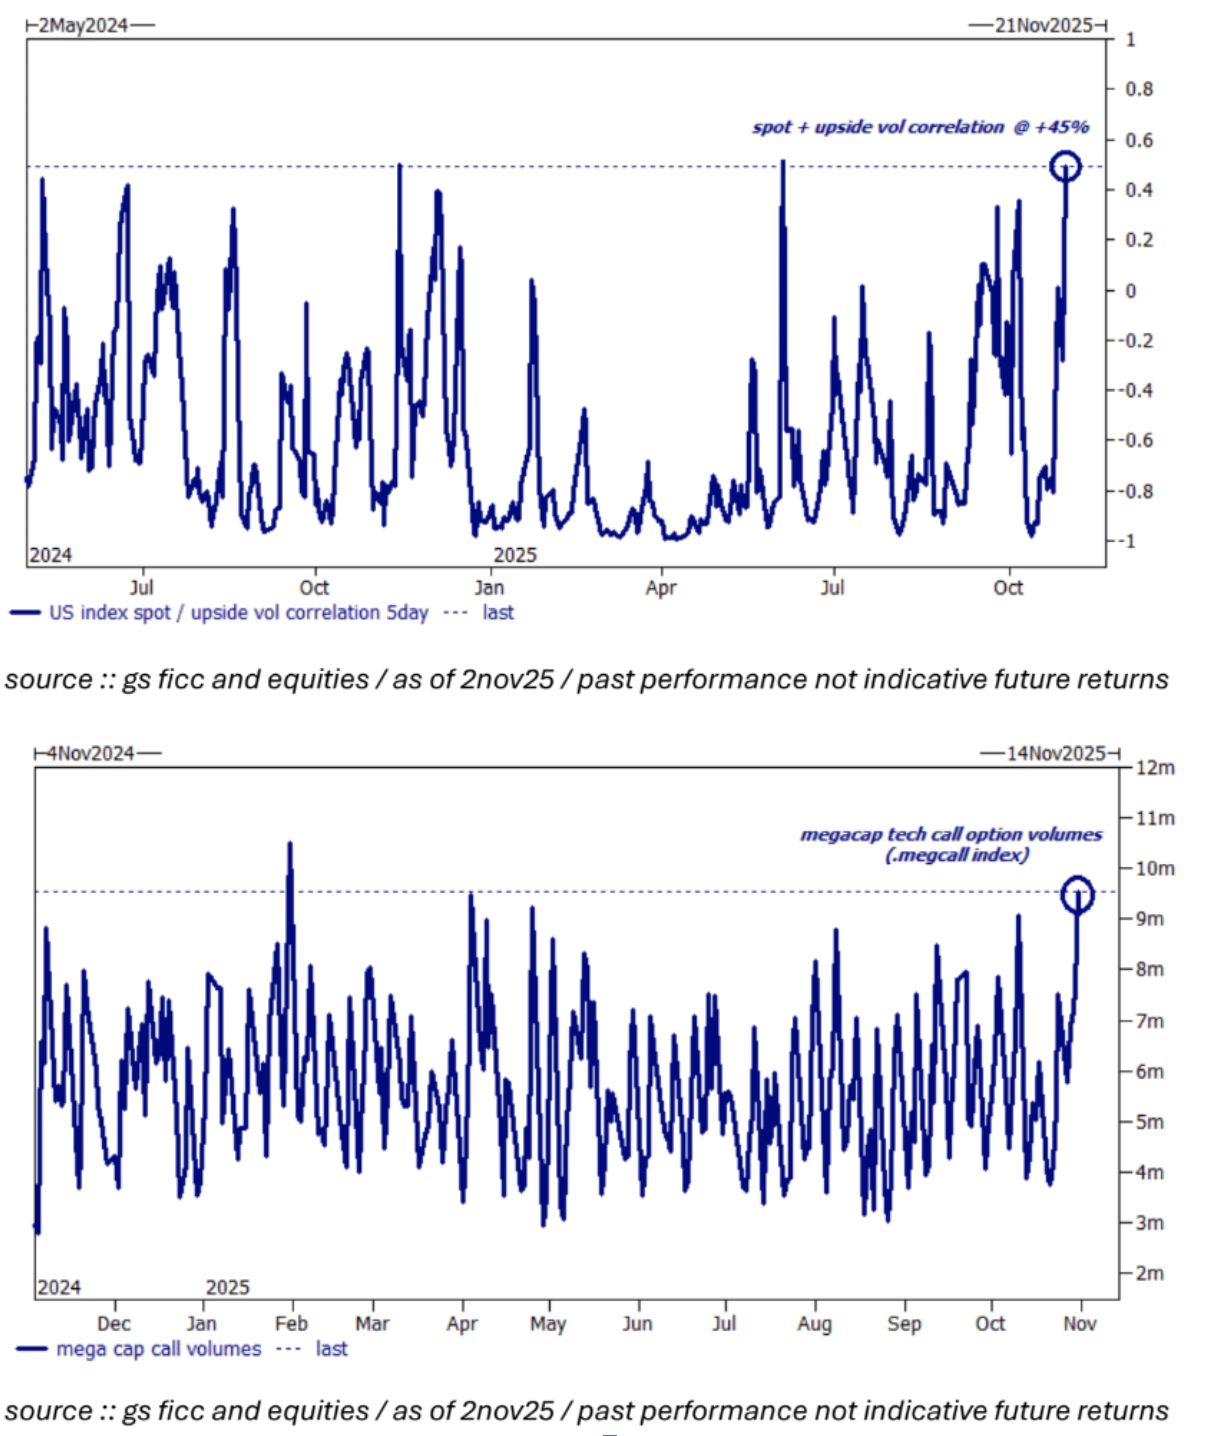
4. Derivatives (Chase I): The realized correlation between upside implied volatility (SPX, RTY, NDX) and their respective spot levels is a positive 40%. Current positioning still lacks the length needed to protect against relative performance anxiety. The “spot up, vol up” dynamic—a favorite anecdote from the derivatives desk—is playing out in real time (see chart).
5. Derivatives (Chase II): Megacap call volumes hit 9.5 million contracts on Friday, marking the second most active session year-to-date. However, skew in these names remains extremely flat, which might be the only bearish signal in this note (see chart).
Disclaimer: The material provided is for information purposes only and should not be considered as investment advice. The views, information, or opinions expressed in the text belong solely to the author, and not to the author’s employer, organization, committee or other group or individual or company.
Past performance is not indicative of future results.
High Risk Warning: CFDs are complex instruments and come with a high risk of losing money rapidly due to leverage. 69% and 73% of retail investor accounts lose money when trading CFDs with Tickmill UK Ltd and Tickmill Europe Ltd respectively. You should consider whether you understand how CFDs work and whether you can afford to take the high risk of losing your money.
Futures and Options: Trading futures and options on margin carries a high degree of risk and may result in losses exceeding your initial investment. These products are not suitable for all investors. Ensure you fully understand the risks and take appropriate care to manage your risk.
Patrick has been involved in the financial markets for well over a decade as a self-educated professional trader and money manager. Flitting between the roles of market commentator, analyst and mentor, Patrick has improved the technical skills and psychological stance of literally hundreds of traders – coaching them to become savvy market operators!