S&P500 Trading Update 11/5/26
S&P500 Trading Update 11/5/26
***QUOTING ES1! FOR CASH US500 EQUIVALENT LEVELS, SUBTRACT POINT DIFFERENCE***
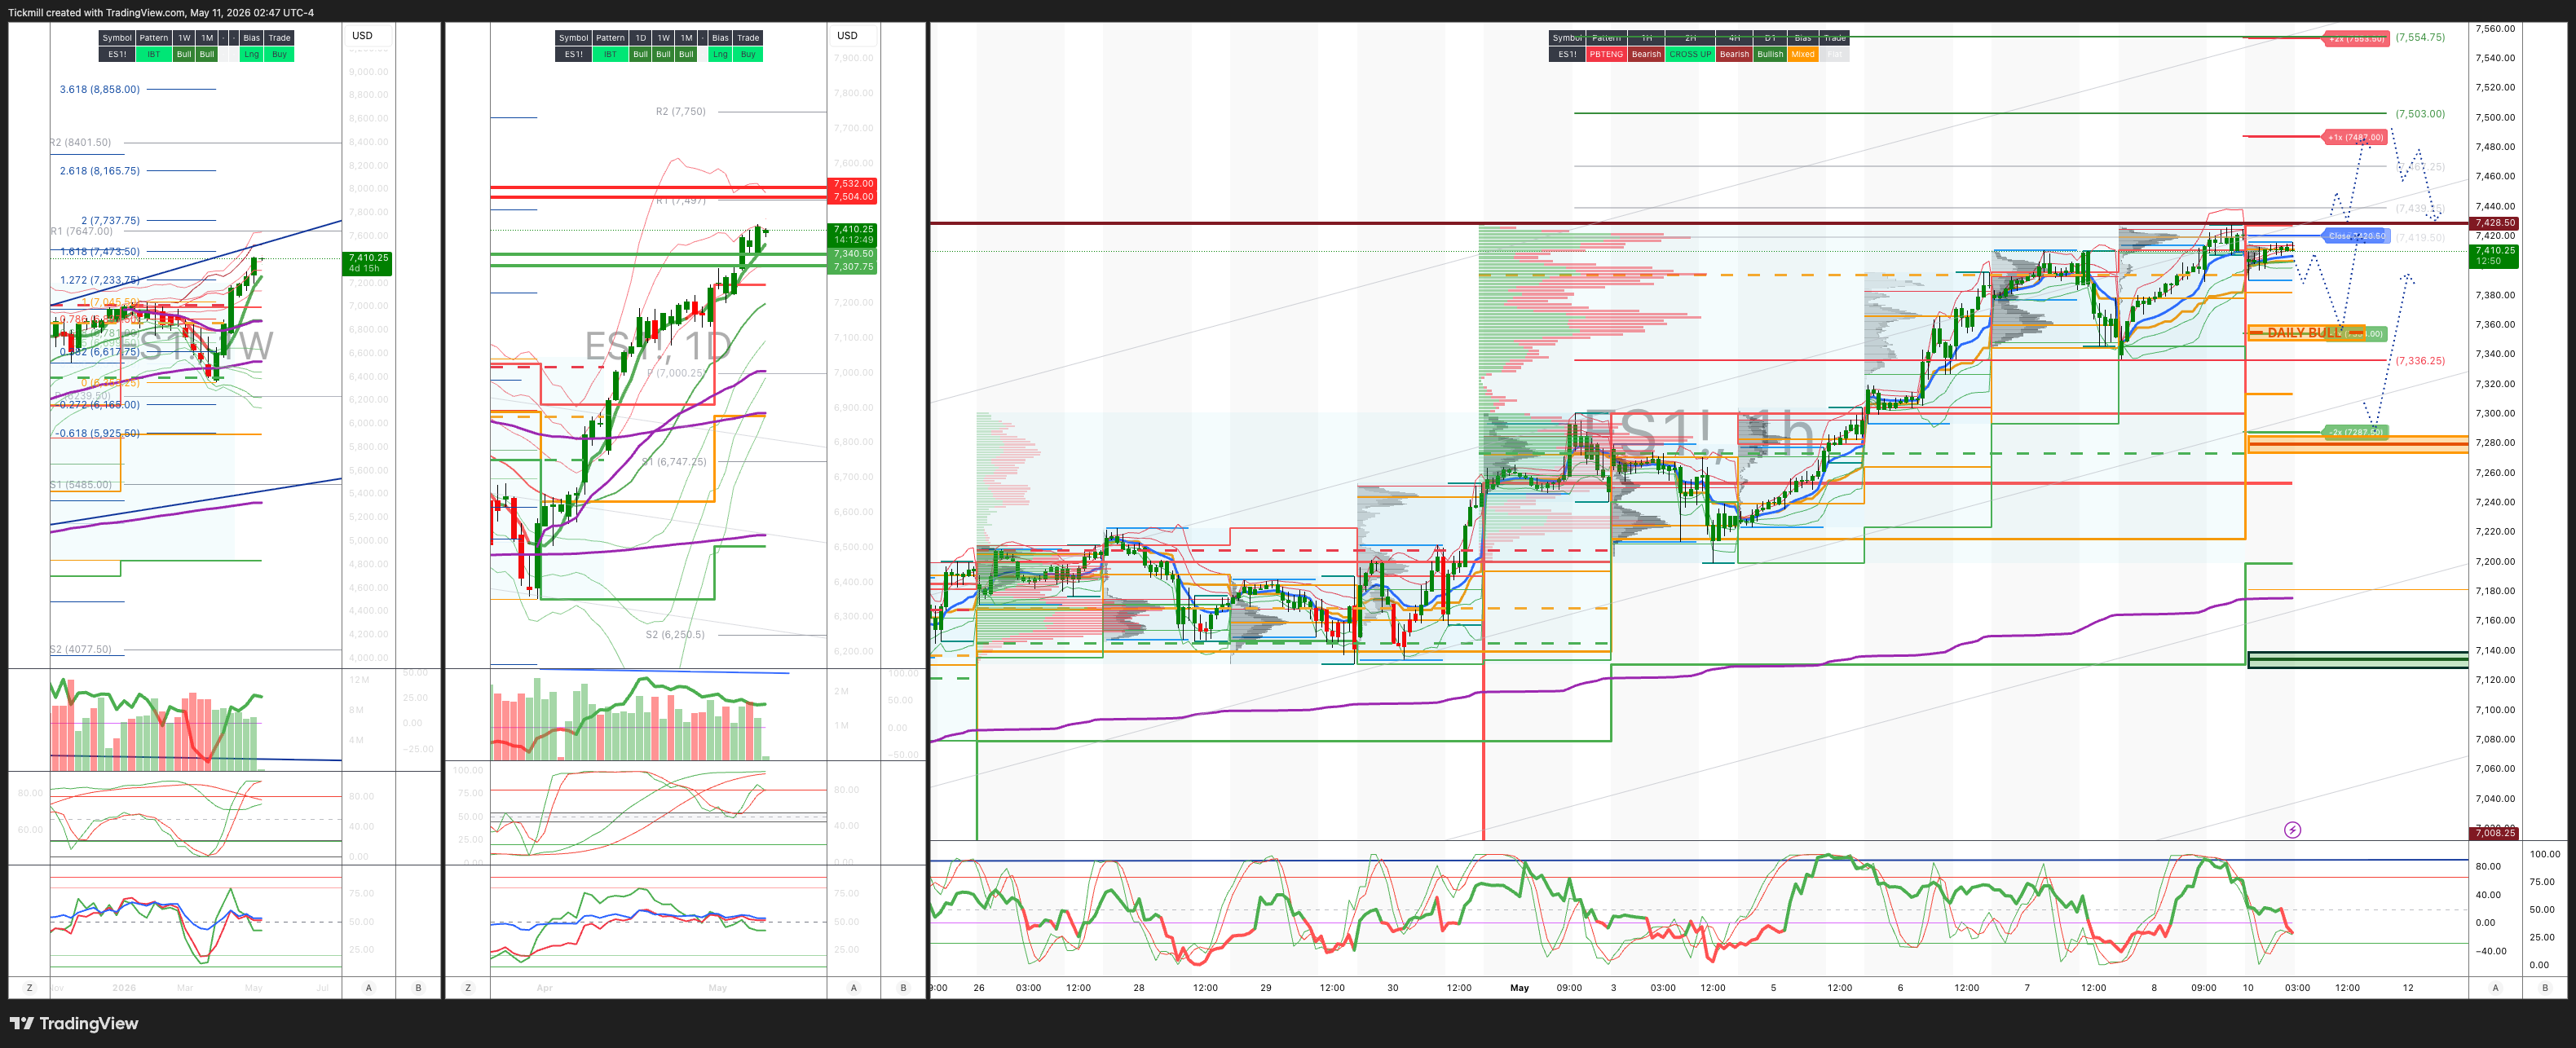
WEEKLY BULL BEAR ZONE 7280/70
WEEKLY RANGE RES 7356 SUP 7138
May OPEX Straddle: 225pt range implies a OPEX to OPEX range of [6900, 7350]
June QOPEX Straddle is 546.4pt giving us a range of [5960,7052]
JHEQX Q2 Collar 6189/6290 - 6865/6955
DEC2025 OPEX to DEC2026 OPEX is 945 points giving us a range of [5889,7779]
SPX PUT/CALL RATIO 1.15 (The numbers reflect options traded during the current session. A put-call ratio below 0.7 is generally considered bullish, and a put-call ratio above 1.0 is generally considered bearish)
DAILY VWAP BULLISH 7368
WEEKLY VWAP BULLISH 7255
MONTHLY VWAP BULLISH 6898
DAILY STRUCTURE – OTFH - 7391
WEEKLY STRUCTURE – OTFH - 7199
MONTHLY STRUCTURE - OTFH - 6514
Balance: This refers to a market condition where prices move within a defined range, reflecting uncertainty as participants await further market-generated information. Our approach to balance includes favouring fade trades at the range extremes (highs/lows) while preparing for potential breakout scenarios if the balance shifts.
One-Time Framing Higher (OTFH): This represents a market trend where each successive bar forms a higher low, signalling a strong and consistent upward movement.
One-Time Framing Down (OTFD): This describes a market trend where each successive bar forms a lower high, indicating a pronounced and steady downward movement.
DAILY BULL BEAR ZONE 7360/50
GAMMA FLIP 7135
DELTA FLIP 6932
DAILY RANGE RES 7487 SUP 7286
2 SIGMA RES 7554 SUP 7287
VIX BULL BEAR ZONE 19.5
TRADES & TARGETS
LONG ON REJECT/RECLAIM DAILY BULL BEAR ZONE TARGET RTH CLOSE > DAILY/WEEKLY RANGE RES
LONG ON REJECT/RECLAIM WEEKLY BULL BEAR ZONE TARGET 7394
LONG ON ACCEPTANCE ABOVE 7430 TARGET DAILY/WEEKLY RANGE RES
SHORT ON REJECT/RECLAIM DAILY/WEEKLY RANGE RES TARGET 7428
***ADDITIONAL SETUPS & TARGETS HIGHLIGHTED ON THE CHARTS***
(I FADE TESTS OF 2 SIGMA LEVELS ESPECIALLY INTO THE FINAL HOUR OF THE NY CASH SESSION AS 90% OF THE TIME WHEN TESTED THE MARKET WILL CLOSE ABOVE OR BELOW THESE LEVELS)
GOLDMAN SACHS TRADING DESK VIEW - ‘Weekend Thoughts’
Nasdaq / AI Bubble Debate: Conditions Are Building, but This Is Not 1999 Yet
The April Nasdaq move was enormous in absolute terms: Nasdaq-100 +3,700 points, or +15.6%, in a single month. But the key point is historical perspective. For anyone who invested $1 in the Nasdaq-100 in May 2014 or earlier, excluding the January-October 2000 dot-com peak window, the April gain alone was greater than their original principal invested. That is a remarkable illustration of compounding: roughly a 7.4x total return over 12 years, and then one month that effectively pays back the initial stake.
The bigger question is whether this is the start of a true equity bubble. The answer, for now, is more nuanced: conditions for a bubble are increasingly visible, but the market does not yet look like a mature bubble.
1. Price action is powerful, but still not comparable to 1999/2000
The current AI-led Nasdaq rally feels dramatic because the nominal market-cap creation is huge, the innovation cycle is moving quickly, and the market leadership is concentrated. But on a percentage-return basis, the current move remains well short of the late-1990s dot-com experience.
That matters. Bubbles are not defined only by narratives; they usually involve some combination of parabolic price gains, valuation excess, retail participation, leverage, and extrapolation of unrealistic growth assumptions. So far, this cycle has had a major move, but it has not matched the late-1990s speed or magnitude.
Even if the current rally is anchored from the post-Liberation Day / Middle East conflict low and compared with the post-LTCM / Russian default rally from October 1998, the trajectories only begin to look similar. The current bull market would still need to run much further to rival the 1998-2000 Nasdaq surge.
Takeaway: the Nasdaq is hot, but it is not yet late-1999 hot.
2. Valuations do not yet scream broad bubble
The most important distinction versus classic bubbles is valuation. The current market has leadership concentration and AI enthusiasm, but it lacks the broad valuation absurdity seen in prior episodes.
| Late-1980s Japanese financial bubble | ~70x |
| 2000s tech bubble leaders | >50x |
| 1970s Nifty Fifty leaders | ~35x |
| Current Mag 7 | ~20x |
That is not cheap in an absolute sense, but it is not bubble math either. In fact, many parts of the market have de-rated because AI uncertainty has created fear of disruption. Broad swathes of equities outside the AI beneficiaries have not been bid up; many have been penalized.
The argument that “everything is in a bubble” is hard to sustain if tech trades cheaper than the broader market on some adjusted metrics, cheaper than consumer stocks, roughly in line with energy, and if the US premium over the rest of the world has eroded when adjusted for earnings growth. Mag 7 valuations are nowhere near prior bubble leaders.
Takeaway: this is an AI-led leadership market, not yet a broad valuation bubble.
3. Earnings growth has been doing the heavy lifting
A key reason this rally looks less bubble-like is that earnings have been exceptionally strong. As of early May, S&P 500 year-over-year EPS growth was running around +25%. Even excluding extraordinary “other income” items from Amazon and Google, EPS growth was still around +16%.
That means the market has actually de-rated on a valuation basis year-to-date, despite the rally. This is very different from a classic bubble dynamic where prices run far ahead of earnings. Even more importantly, equity strategists expect EPS growth to accelerate over the next two quarters. If that happens, the market can continue to rise without necessarily expanding multiples materially.
Takeaway: the rally has been backed by earnings, not just multiple expansion.
4. The “bearish” macro inputs could ironically extend the rally
There are clear reasons investors are reluctant to fully extrapolate the AI story: tech layoffs are accelerating, Middle East risk threatens another inflation impulse, oil and refined product inventories are depleted in many regions, long-end yields remain elevated, UK borrowing rates have hit 25-year highs, the US 30-year yield is back around 5%, and money market assets are enormous at around $7.75tn after a $122bn weekly inflow, the largest since April 2020.
But the irony is that some of these bearish inputs could become bullish if they reverse. The labor-market story is increasingly “K-shaped”: AI and software firms are cutting headcount, but capex and infrastructure spending remain strong. That makes it difficult for the Fed to hike aggressively if labor headlines soften, even if inflation hawks remain vocal.
Similarly, if there is an Iran resolution and oil falls meaningfully, the market could quickly move from worrying about energy-driven inflation to pricing lower inflation, lower yields, and more Fed optionality. With trillions sitting in money market funds, any decline in yields could create a significant reallocation impulse into equities and credit.
Takeaway: if oil falls and yields ease, the market has a lot of dry powder available.
5. The real bubble catalyst: AI ROI clarity
This is the most important point. Since the launch of ChatGPT in 2022, the biggest substantive shift in the economy and markets has not simply been AI enthusiasm. It has been the huge hyperscaler capex cycle. This has become the foundation of what may be the largest investment cycle of our lifetime.
The key uncertainty has been ROI. Investors have repeatedly asked whether hyperscalers will earn adequate returns on AI infrastructure, whether token demand can scale fast enough, whether model providers can achieve sustainable margins, whether enterprise AI can move from experimentation to production, and whether capex normalizes or keeps accelerating.
The argument now is that this uncertainty may be starting to resolve positively. Agentic AI could drive a dramatic increase in token consumption: 24x to around 120 quadrillion tokens per month by 2030, with enterprise agents potentially becoming the largest token multiplier. Token consumption could rise 55x by 2040, while hyperscalers and model providers may see a positive gross margin inflection over the next 3-12 months. That would make infrastructure spending more sustainable across the ecosystem.
This is the crux of the bull case. If AI usage scales rapidly and gross margins inflect positively, then today’s capex is not speculative waste; it is infrastructure for a massive monetizable demand curve. That would be the moment when the market moves from “AI capex is a cost burden” to “AI capex is the new cloud infrastructure supercycle.”
Takeaway: a true bubble requires ROI confidence. That may be the next catalyst.
So, Are Conditions in Place for an Equity Bubble?
Not fully — but increasingly, yes.
The preconditions are forming: a transformative technology narrative, massive capex, concentrated leadership, improving evidence of monetization, strong earnings growth, large pools of cash on the sidelines, potential for yields to fall if inflation/oil risks fade, investors not yet fully all-in, and upside optionality around agentic AI.
But the missing ingredients are still important. Broad valuation excess is not present, Nasdaq price action has not matched the late-1990s trajectory, Mag 7 valuations are not absurd relative to prior bubbles, large parts of the market remain de-rated, investors remain cautious and hedged, and geopolitical/oil risks still cap animal spirits.
So the current market is better described as a credible secular bull market with bubble optionality, rather than a bubble already in full force.
Trading Implications
The strongest risk/reward remains in the “picks and shovels” of AI: memory, cooling, optical networks, power equipment, grid infrastructure, data-center construction, AI chip suppliers, and select REITs tied to infrastructure demand. The market is increasingly rewarding tangible AI monetization and capacity bottlenecks.
The next phase depends less on whether capex is large and more on whether investors believe it is earning returns. Key signals include cloud revenue acceleration, AI services attach rates, token usage growth, inference demand, enterprise-agent adoption, gross margin stabilization or inflection, and capex guidance being raised without stock punishment. If hyperscalers can raise capex and rally, that is the clearest sign the market is embracing the supercycle thesis.
Bubble risk rises if yields fall. A dovish macro turn could be the accelerant: Iran risk fades, oil falls, CPI expectations decline, long yields ease, money market yields fall, cash rotates into equities, AI winners re-rate, and retail/momentum flows return aggressively. That is how a secular bull can morph into a bubble.
The biggest downside risk is still oil + rates + AI disappointment. Middle East escalation could lift oil again, CPI passthrough could become visible, the Fed could remain on hold or turn more hawkish, long yields could rise, AI capex ROI could remain uncertain, hyperscaler margins could disappoint, and crowded semis could unwind. That would not necessarily end the AI cycle, but it could create a sharp correction in the highest-duration winners.
The Nasdaq’s April move was extraordinary, but it does not yet resemble a mature dot-com-style bubble. Price gains are still far smaller than the late-1990s surge, valuations are far less extreme, and earnings growth has been strong enough that the market has de-rated year-to-date.
The real question is whether the next phase brings AI ROI validation. If agentic AI drives explosive token consumption and hyperscalers show gross margin inflection over the next 3-12 months, the market could begin to price a much larger AI infrastructure supercycle. Add falling oil, lower yields, and nearly $7.75tn in money market assets, and the ingredients for a bubble could come together quickly.
For now: not a bubble yet — but the conditions for one are increasingly in place.
Disclaimer: The material provided is for information purposes only and should not be considered as investment advice. The views, information, or opinions expressed in the text belong solely to the author, and not to the author’s employer, organization, committee or other group or individual or company.
Past performance is not indicative of future results.
High Risk Warning: CFDs are complex instruments and come with a high risk of losing money rapidly due to leverage. 69% and 73% of retail investor accounts lose money when trading CFDs with Tickmill UK Ltd and Tickmill Europe Ltd respectively. You should consider whether you understand how CFDs work and whether you can afford to take the high risk of losing your money.
Futures and Options: Trading futures and options on margin carries a high degree of risk and may result in losses exceeding your initial investment. These products are not suitable for all investors. Ensure you fully understand the risks and take appropriate care to manage your risk.
Patrick has been involved in the financial markets for well over a decade as a self-educated professional trader and money manager. Flitting between the roles of market commentator, analyst and mentor, Patrick has improved the technical skills and psychological stance of literally hundreds of traders – coaching them to become savvy market operators!